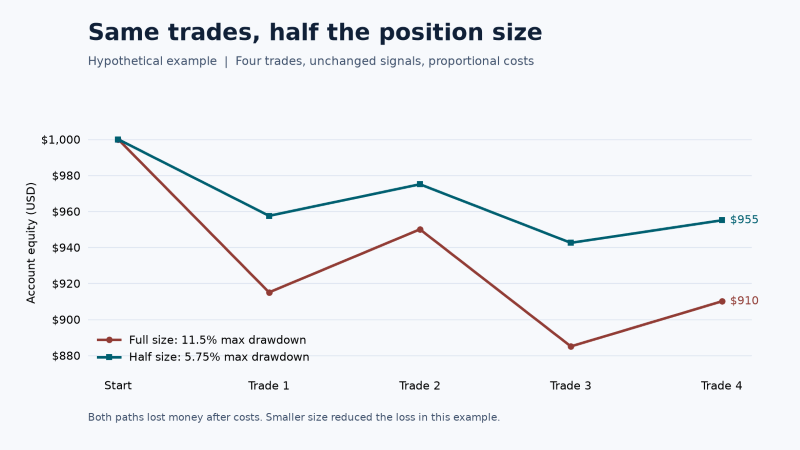
Cutting your position in half can make a drawdown easier to sit through. It can also make it harder to see that the same trading rule is losing money. If the entries and exits stay the same, the smaller position changes how much each trade moves your account. It does not explain why the trades lose.
This matters when you look at a chart after a rough week. A smoother line can feel like proof that the new settings work. Before taking that as a result, check what actually changed. Did the rule make different decisions, or did you put less money behind the same decisions?
Compare the same four trades at two sizes
Imagine an account starts with $1,000. The next four trades, in order, produce gross changes of minus $80, plus $40, minus $60 and plus $30. Gross means before trading costs. In this example, each trade costs $5 at full size. After costs, the changes are minus $85, plus $35, minus $65 and plus $25.
The account goes from $1,000 to $915, then $950, then $885 and finally $910. The trades lose $70 before costs and $90 after costs. The lowest balance is $885. Relative to the previous high of $1,000, that’s a $115 decline, or an 11.5% drawdown.
Now run the same trades at half size. Assume every price move and trading cost scales exactly with the position. The balance goes from $1,000 to $957.50, then $975, then $942.50 and finally $955. The account loses $45, and its maximum drawdown is 5.75%. No signal arrived earlier. No exit improved. Both versions lost money.
The figure shows equity after each trade closes. It has a useful blind spot: you can’t tell how far a trade went against you while it was still open. An account rule that watches open positions needs a separate check. A line built only from closed trades cannot tell you whether you crossed an intraday loss limit.
Measure the drop from the right number
Drawdown measures the fall from an earlier high. At each step, keep the highest account equity seen so far. Subtract current equity from that high, then divide by the high. The largest value is the maximum drawdown for the series you measured.
In our example the starting balance stays the high throughout. In a longer test, the high can move up. If you always divide by the starting balance or look only for the lowest balance, you can miss a large fall that happens after the account has already risen. Use the same measurement and observation times for both sizes.
Separate position value from loss at the exit
Take another hypothetical example. Bitcoin is priced at $50,000, and a trader plans to exit at a trigger of $49,000. The distance is $1,000 per bitcoin. At 0.02 BTC, that puts $20 between the entry and the planned exit, before costs. At 0.01 BTC, the same distance puts $10 at risk on that calculation.
The 0.02 BTC position is worth $1,000 at entry. That is the value of the position, not the $20 distance to the planned exit. Account equity is a third number: it’s what the whole account is worth, including open positions. Write down all three separately. This example uses an unleveraged spot position. If you test a product with margin or liquidation, those rules need to be part of the test.
The trigger price is also distinct from the fill price. If an exit turns into a market order and the available prices have already moved down, the fill can be worse. That difference is called slippage. The $20 and $10 figures assume the planned fill and omit costs, so they are estimates from the setup, not limits on the actual loss.
Check what the smaller position changed
Keep a copy of the rule before changing it. Write down what enters a trade, what exits it and when each decision is made. Decide whether a signal uses a finished candle or a price inside that candle. Then save the trade list with times, entry prices and exit prices. If you’re comparing size alone, the list should match in both runs.
Add the costs you can measure. Start with the fee charged on the entry and exit. Then check the spread, the difference between the price to buy and the price to sell. If your test prices already include that difference, don’t subtract it a second time. Leave room for worse fills when the market moves fast.
The four-trade example assumes costs halve with size. Real results can break that relationship. A fixed charge takes a bigger bite out of the smaller trade. A minimum order size can prevent the smaller position from opening at all. At the other end, a bigger order may need more than one fill. Those are changes to the trades or their costs. Record them so they don’t get mistaken for an improvement in the signals.
Give the trading rule its own test
Put the two runs side by side. Compare the number of trades, the net result after costs and the maximum drawdown. Ask what changed first. If the entries and exits match and both runs lose, smaller size has reduced the cost of those losses. A smaller drawdown alone gives you no reason to expect the rule to earn money later.
If you suspect the rule itself is the problem, change one part you can name. For example, compare a signal on a finished candle with the same signal allowed before the candle closes. Keep the sizing and cost assumptions unchanged for that comparison. Check the revised rule on a period you didn’t use to choose the change. A better result on the same period you used to tune it can be a better fit to that history rather than a more reliable rule.
A simple worksheet is enough to start. Give each trade a row. Put the time, entry, exit, quantity, fees and estimated slippage in separate columns. Add net profit or loss, running equity, the running high and the drawdown from that high. Run the sheet first with fixed trades and two sizes, then with one rule change and fixed size. Four trades show how the arithmetic works. A larger, separate sample is what lets you ask whether the rule holds up.
Author Bio
I’m Arnold Holm and I run StratCoreAlpha. I build trading tools and write about how fixed trading rules hold up after costs.
Disclaimer: This article is for educational and informational purposes only. It is not financial, investment, tax, or legal advice. Cryptocurrency is highly volatile, and investors can lose some or all of their capital. Always do independent research and consult a qualified professional before making investment decisions.